By: Layne Farr | Senior Manager – Real Estate
The assessed values of Dallas County industrial distribution centers increased a median of +10% in 2022 and +12% in 2023. A+ and A class distribution centers specifically saw the steepest increases in 2023, the median change in value being +14%. On a per square foot basis, A/A+ class distribution rose to $64 PSF in 2023 from $57 PSF in 2022 and $52 PSF in 2021. A county-wide median value breakdown by class is shown in the table below:
| Comparability Cd | 2021 $PSF | 2022 $PSF | 2022 YOY | 2023 $PSF | 2023 YOY |
| A+ Class | $54 | $59 | 9% | $67 | 14% |
| A Class | $50 | $55 | 11% | $62 | 13% |
| B Class | $41 | $45 | 14% | $50 | 10% |
| C Class | $32 | $35 | 7% | $39 | 9% |
This analysis reviews the variation in assessed values of distribution centers in 2023 with respect to submarket location and comparability class (as defined by the Dallas Central Appraisal District). Note: these data points are a snapshot of the tax records as of February 2nd, 2024. The continued settlement of open 2023 litigation may see the 2023 figures quoted here reduced by some margin. All data used is from the Dallas Central Appraisal District public data download portal. All figures quoted are median values.
The first map below describes the percent change in value for A/A+ class distribution centers from 2022 to 2023. The colors indicate whether the change is above (red) or below (blue) the overall 2023 county median of +14% for this product class. The second map is similar but describes assessed value per square foot for A/A+ class distribution centers. The county median for A/A+ assessed value PSF in 2023 is $64 PSF.
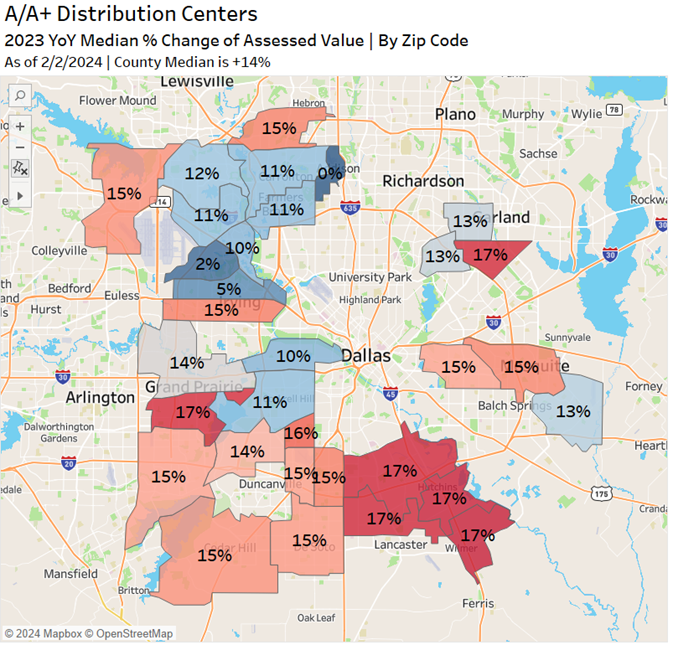

While the markets surrounding the DFW international airport continue to see the highest assessed values per square foot in the county, the South Dallas submarkets experienced the greatest percent change in assessed values in 2023. The Southeast Dallas/I-45 submarket, including Hutchins, Lancaster, and Wilmer, is one of the largest and fastest growing in the DFW region with 82M SF of total industrial inventory and 3M SF currently under construction. While the YoY change for distribution centers in this submarket during the 2022 tax year was +9%; 2023 values are +17% greater than their 2022 counterparts (outpacing the +14% county median). On a per square foot basis: A/A+ class product has increased from $48 to $52 to $61 PSF through 2021 to 2023. The Southwest Dallas corridor along Highway 67, including Redbird, tells a similar story. The typical value increase in 2023 is +15% and A/A+ values in 2023 range from $60 to $64 PSF.
Year-over-year percent increases and values per square foot for distribution centers in the Mesquite submarket align with the trends seen in the South Dallas markets. A/A+ class product saw +15% increases to about $61 PSF. Garland submarket varies slightly; less steep percentage increases year-over-year, but steeper value per square foot for the A/A+ class product ($67 PSF).
2023 assessed values for A+ class distribution centers in the North and East DFW airport markets, including Irving, Coppell, and Grapevine, crept into the $80+ PSF range. A/A+ values for 2023 for the entire airport area vary between $65 to $80 PSF: this includes the Valwood (Carrollton, Farmers Branch) and Addison submarkets just a bit further East. DFW Airport is the highest valued per square foot industrial market in the county in both 2022 and 2023. Because the values were already elevated in 2022, this area did not garner the same YoY aggression from the appraisal district seen in the South Dallas submarkets for the 2023 tax year; however, in 2022 the Valwood and Hines submarkets lead the county with the biggest increases in value ranging from +15% to +25% while just about every other submarket saw between +8 to +11%.
Despite the sharp increase in the cost of debt over the past two years, 50% of respondents to the Emerging Trends in Real Estate 2024 Survey (PWC) indicate that 2024 is a ‘buy’ year for warehouse space and 57% of respondents believe that warehouses are ‘fairly priced’. Dallas County experienced about $520M of sales volume across 2023 with disclosed sales prices typically residing between $97 and $108 PSF (CoStar). Although this sales volume is a major decrease from 2021 and 2022 levels, it appears the Dallas Central Appraisal District continues to have room to increase assessed value moving into the 2024 tax year and have recently not been shy to do so.
For a further breakdown of assessed values by class and city, click here: